How much inventory is on the Austin housing market right now?
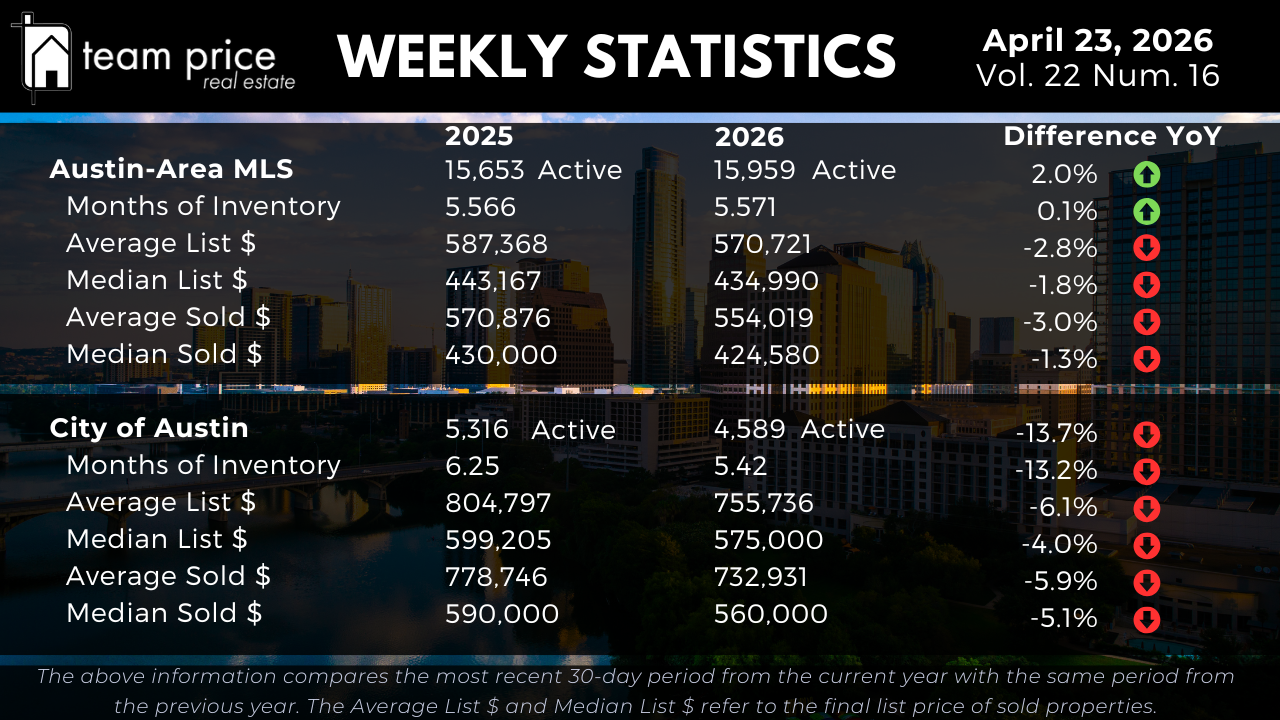
The Austin-Area MLS currently shows 15,959 active listings, up from 15,653 at this time last year, a 2.0 percent increase. Months of inventory sits at 5.57 months, essentially unchanged from 5.57 months a year ago. That is a textbook definition of a balanced regional market: supply has edged up slightly, but the pace of sales has kept up with it.
The City of Austin tells a different story. Active listings have dropped from 5,316 a year ago to 4,589 today, a 13.7 percent decline. Months of inventory inside city limits has tightened from 6.25 months to 5.42 months, a 13.2 percent decrease. Austin proper is absorbing its supply meaningfully faster than the surrounding region, which is a notable reversal from the pattern that defined 2023 and 2024. The gap between the two geographies is the single most important framing for anyone buying or selling in Central Texas right now.
What are homes selling for in the Austin-Area MLS?
The average sold price across the Austin-Area MLS is currently $554,019, down 3.0 percent from $570,876 a year ago. The median sold price is $424,580, a 1.3 percent decline from $430,000 last year. Average active list price is $570,721, down 2.8 percent year over year. Median active list price is $434,990, down 1.8 percent.
All of these pricing figures represent the final list price of properties that actually sold over the most recent 30-day period, compared to the same 30-day period last year. The pattern across the region is a shallow, measured downshift rather than anything resembling a steep correction. Sold prices are compressing slightly faster than list prices, which tells you where negotiation is happening and why inventory alone does not explain this market.
How much are homes selling for in the City of Austin?
Inside the City of Austin, the median sold price is $560,000, down 5.1 percent from $590,000 a year ago. The average sold price is $732,931, a 5.9 percent decline from $778,746 last year. Average active list price is $755,736, down 6.1 percent, and median active list price is $575,000, down 4.0 percent.
This is where the inventory split gets interesting. City of Austin prices are adjusting more than the broader MLS even as inventory inside the city is tightening. Two forces are colliding: fewer homes are reaching the market in Austin proper, but the homes that do sell are trading at meaningfully lower price points than a year ago. That is a mix-shift signal. Buyers are finding value at price points that did not exist inside the city in 2022 or 2023, which is almost certainly part of why city inventory is absorbing faster even as suburban supply builds.
How much negotiation room do Austin buyers have right now?
The current sold-to-list price ratio across the Austin-Area MLS is 97.70 percent, meaning the average buyer is closing about 2.3 percent below the final list price. So far this month, 62.09 percent of sold properties closed below list price, down from 65.13 percent last month. At list price, 21.87 percent of sales, essentially flat from 21.73 percent last month. And above list price, 16.04 percent of sales, up from 13.13 percent last month and ahead of the 15.37 percent figure from April 2025.
The headline here is that the share of homes selling above list has climbed for three consecutive reference points. Most homes still sell below list, but the competitive tier at the top of the market is tightening. That tightening is most visible inside the City of Austin, where lower supply is pulling well-prepared listings into multiple-offer territory more often than they were a month ago. The broader regional buyer pool retains real leverage on everything else.
Which Austin-area cities and ZIP codes are gaining price momentum?
Across the 30 cities tracked in Central Texas, 13 posted a month-over-month price increase, or 43 percent, while 16 posted a decrease, or 53 percent. On a year-over-year basis, 10 cities, or 33 percent, are up in price, and 20 cities, or 67 percent, are down. From each city's 12-month peak, only 1 city is above that high-water mark, and 29 are below it.
At the ZIP code level, 29 of 75 tracked ZIPs, or 39 percent, showed a month-over-month price increase, and 46, or 61 percent, showed a decrease. Year over year, 28 ZIPs, or 37 percent, are up, and 47, or 63 percent, are down. From each ZIP's 12-month peak, 1 ZIP is above and 74 are below.
The takeaway reinforces this week's core theme: the Austin-area market is not moving as a single block, and the regional-versus-city split is only the largest layer of the story. Nearly two out of every five ZIP codes showed price gains this month. The other three are soft. Submarket selection is doing more work than it has in years, and headline regional averages obscure what is actually happening on specific streets in specific neighborhoods.
How far are Austin home prices from their peak?
Across the Austin-Area MLS, the median sold price of $434,628 is 19.2 percent below its May 2022 peak of $538,000. The average sold price of $562,235 is 15.4 percent below its May 2022 peak of $664,515. Median sold price per square foot, at $215, is 23.2 percent below its April 2022 peak of $280. Average list price is 5.6 percent below the March 2023 peak, and median list price is 12.9 percent below its May 2022 peak.
Inside the City of Austin, the median sold price of $551,000 is 19.0 percent below its May 2022 peak of $680,000. Average sold price of $717,721 is 15.3 percent below the May 2022 peak of $847,583. Average sold price per square foot, at $342, is 22.6 percent below its May 2022 peak of $442. Average list price is 11.1 percent below its September 2025 peak of $957,695, and median list price is 9.7 percent below the May 2022 peak of $658,589.
One item to note: the median sold price per square foot figure for the City of Austin in this week's source data did not fully reconcile on verification, so we are holding that single data point for confirmation rather than publishing an unverified number. The broader signal is that Central Texas real estate has now spent nearly four years below its 2022 pricing peak, and the majority of the reset has already happened. Price per square foot, the purest measure of value, has absorbed the largest decline across both geographies.
What is the outlook for the Austin housing market heading into May?
Three patterns are worth watching as the spring selling season continues. First, the divergence between regional inventory growth and City of Austin inventory contraction is now large enough to affect pricing strategy on both sides of the transaction. Buyers have wider selection in the suburbs and exurbs; sellers inside the city are operating in a tighter competitive field. Second, the above-list share of sales has climbed for three straight comparison points, which suggests the top end of the demand curve is firming even as the middle and bottom retain negotiation room. Third, the fact that 13 of 30 cities and 29 of 75 ZIPs posted month-over-month gains in a market where most regional averages are still down year over year is a sign that local momentum is rebuilding unevenly. That is what a transition market looks like before it turns.