

Is It Cheaper to Rent or Buy in Austin? 2025 Data Analysis
Published | Posted by Dan Price
Is It Cheaper to Rent or Buy in Austin? A Data-Driven Analysis
Deciding whether to rent or buy a home in Austin, Texas, is a significant financial choice that depends on various economic factors. With Austin's booming real estate market and rising costs, many residents are grappling with this question. Using detailed data from a comprehensive 2025 Renting vs. Buying Analysis by Team Price Real Estate, this article explores the costs associated with renting and buying in Austin, focusing on median Principal, Interest, Taxes, and Insurance (PITI) payments compared to median rent. The analysis covers not only Austin as a whole but also specific zip codes and surrounding cities, providing a clear picture of the financial implications of each option.
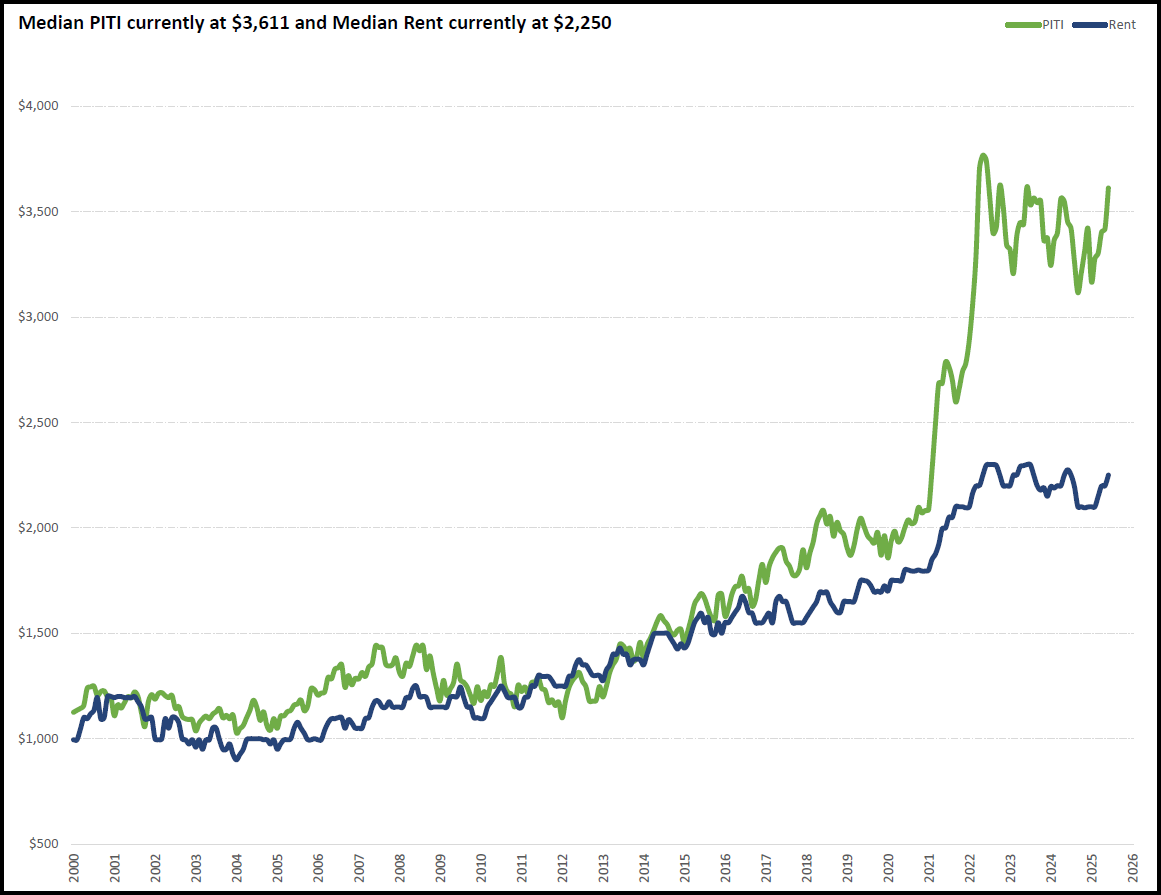
The median PITI in Austin, as of June 10, 2025, stands at $3,611 per month, while the median rent is $2,250 per month. This creates a significant gap of $1,361, meaning that renting is currently $1,361 cheaper per month than buying a home with a typical mortgage payment. This difference highlights a key trend: in Austin, renting is generally more affordable than buying in terms of monthly housing costs. The PITI to Rent Ratio, which compares the cost of owning to renting, is 1.6 for Austin in 2025. This ratio indicates that the cost of owning a home (PITI) is 1.6 times higher than renting, further underscoring the financial advantage of renting in the current market.
Looking at specific areas within Austin, the data reveals consistent patterns across various zip codes. For example, in zip code 78701, which covers downtown Austin, the median PITI is $5,656, while the median rent is $3,183, resulting in a PITI to Rent Ratio of 1.8. This means that buying a home in this area costs 1.8 times more than renting. Similarly, in zip code 78704, a popular neighborhood known for its vibrant culture, the PITI is $6,964 compared to a median rent of $2,633, yielding a PITI to Rent Ratio of 2.6. Across all 75 zip codes analyzed in the Austin area, the data shows that in no zip code is the PITI less than the median rent, reinforcing the trend that renting is cheaper than buying throughout the city.
The financial burden of homeownership in Austin is further highlighted when comparing the percentage of household income spent on housing. In Austin, the median household income is $110,300. The median PITI of $3,611 consumes 51.3% of this income, a substantial portion that could strain many budgets. In contrast, the median rent of $2,250 accounts for 24.7% of household income, aligning more closely with the recommended 25-30% of income for housing costs. For instance, in zip code 78703, where the median household income is $125,448, the PITI of $13,139 represents 125.7% of income, while rent at $3,065 takes up 29.3%. This stark contrast illustrates that renting is not only cheaper but also more manageable for most households in terms of income allocation.
Historical data from the analysis provides context for these current trends. From 2000 to 2020, the PITI to Rent Ratio in Austin fluctuated between 0.9 and 1.3, indicating that renting and buying costs were relatively close or, at times, renting was slightly more expensive. However, starting in 2021, the ratio began to climb, reaching 1.3, and by 2022, it hit 1.5. This upward trend continued, with the ratio stabilizing at 1.5 to 1.6 from 2023 to 2025. The increase reflects rising home prices and mortgage interest rates, which have outpaced rent increases, making homeownership progressively more expensive relative to renting.
The analysis also extends to surrounding cities, offering a broader perspective on the Austin metro area. In cities like Cedar Park, Leander, and Round Rock, the pattern holds: PITI exceeds rent in every case. For example, in Cedar Park, with a median household income of $110,478, the PITI is $4,194, while rent is $2,330, resulting in a PITI to Rent Ratio of 1.8. In Leander, the PITI of $4,386 compares to a rent of $2,235, yielding a ratio of 2.0. Even in more affordable cities like Kyle, where the PITI is $2,922 and rent is $1,986, the ratio is 1.5, indicating that renting remains the less expensive option. Across 30 cities analyzed, none show PITI lower than rent, suggesting that the cost advantage of renting is a regional phenomenon.
Another critical factor is the percentage difference between renting and buying costs. In Austin, the median PITI is 52.0% higher than the median rent, as calculated from the $1,361 monthly difference. In specific zip codes, this percentage difference can be even more pronounced. For instance, in zip code 78730, the PITI of $11,259 is 84.1% higher than the rent of $1,792. In contrast, zip code 78747 shows a smaller gap, with PITI ($3,028) being 22.6% higher than rent ($2,343). These variations reflect differences in home prices and rental markets across Austin’s neighborhoods, but the consistent trend is that renting offers monthly savings compared to buying.
The data also sheds light on the long-term implications of renting versus buying. The Sold to Rent Ratio, which estimates how many years of rent would equal the cost of buying a home, averages 23.7 in Austin. In zip code 78746, this ratio reaches 45.6, indicating that it would take over 45 years of renting to match the cost of buying a home in that area. While buying a home offers potential equity growth, the high upfront and ongoing costs, as reflected in the PITI, make renting a more immediate cost-saving choice for many residents.
In conclusion, the 2025 data clearly shows that renting is cheaper than buying in Austin across all analyzed zip codes and surrounding cities. With a median PITI of $3,611 compared to a median rent of $2,250, renting saves households $1,361 per month on average. The PITI to Rent Ratio of 1.6, combined with the high percentage of income required for PITI, underscores the financial advantage of renting in the current market. Whether in downtown Austin or suburban areas like Pflugerville or Georgetown, the cost of homeownership significantly exceeds renting, making it a more affordable option for most residents as of June 2025.
FAQ Section
1. What is the average cost difference between renting and buying in Austin in 2025?
The average cost difference between renting and buying in Austin, based on 2025 data, is $1,361 per month. The median Principal, Interest, Taxes, and Insurance (PITI) payment for homeowners is $3,611, while the median rent is $2,250. This gap translates to a 52.0% higher cost for buying compared to renting. Across Austin’s zip codes, the difference varies, ranging from $686 in zip code 78747 (PITI: $3,028, rent: $2,343) to $12,649 in zip code 78746 (PITI: $17,657, rent: $5,008). In surrounding cities, similar trends persist, with differences like $2,151 in Leander (PITI: $4,386, rent: $2,235) and $1,348 in Round Rock (PITI: $3,546, rent: $2,198), highlighting that renting consistently offers monthly savings.
2. How does the PITI to Rent Ratio affect the decision to rent or buy in Austin?
The PITI to Rent Ratio, which compares the monthly cost of homeownership (Principal, Interest, Taxes, and Insurance) to renting, is a critical metric for understanding housing affordability. In Austin, the 2025 PITI to Rent Ratio is 1.6, meaning owning a home costs 1.6 times more than renting. For example, in zip code 78701, the ratio is 1.8 (PITI: $5,656, rent: $3,183), while in 78703, it’s 4.3 (PITI: $13,139, rent: $3,065). A ratio above 1 indicates that renting is cheaper, and since no Austin zip code or surrounding city has a ratio below 1, renting is the more affordable choice. Historically, the ratio was closer to 1 (e.g., 0.9 in 2012), but the rise to 1.6 reflects increasing home prices and interest rates, making renting a financially prudent option.
3. What percentage of income goes toward rent versus PITI in Austin?
In Austin, the median household income is $110,300, and the 2025 data shows a significant disparity in income allocation for housing. The median PITI of $3,611 consumes 51.3% of household income, far exceeding the recommended 25-30% for housing costs. In contrast, the median rent of $2,250 accounts for 24.7% of income, aligning with financial guidelines. Across zip codes, the disparity is stark: in 78703, PITI ($13,139) takes 125.7% of income ($125,448), while rent ($3,065) takes 29.3%. In 78747, PITI ($3,028) is 41.8% of income ($86,862), while rent ($2,343) is 32.4%. This trend extends to surrounding cities like Cedar Park (PITI: 45.6%, rent: 25.3%) and Kyle (PITI: 43.5%, rent: 29.6%), indicating that renting is more sustainable for household budgets.
4. Are there any areas in Austin where buying is cheaper than renting?
According to the 2025 Renting vs. Buying Analysis, there are no areas in Austin or its surrounding cities where buying is cheaper than renting. In all 75 zip codes and 30 cities analyzed, the median PITI exceeds the median rent. For instance, in Austin’s zip code 78725, the PITI is $2,531 compared to a rent of $1,900, a difference of $632 and a PITI to Rent Ratio of 1.3. In Wimberley, the PITI is $5,408 versus a rent of $2,065, a $3,343 gap with a ratio of 2.6. The smallest difference is in Jarrell, where PITI ($2,344) is $537 higher than rent ($1,807), but even here, renting remains cheaper. This consistent pattern across diverse neighborhoods and suburbs confirms that renting is the more cost-effective option throughout the Austin metro area.
5. How have renting and buying costs in Austin changed over time?
The 2025 analysis provides historical data showing that renting has become increasingly cheaper relative to buying in Austin. From 2000 to 2011, the PITI to Rent Ratio ranged from 0.9 to 1.2, indicating that renting and buying costs were often comparable, with renting occasionally more expensive (e.g., 0.9 in 2012). However, from 2021, the ratio rose to 1.3, then to 1.5 in 2022, and stabilized at 1.5-1.6 from 2023 to 2025. This shift reflects rising home prices and mortgage interest rates outpacing rent increases. For example, in 2021, the ratio of 1.3 meant PITI was 30% higher than rent, but by 2025, the 1.6 ratio indicates a 60% higher cost for buying. This trend, coupled with a 52.0% cost difference ($1,361 monthly), underscores the growing affordability of renting over time.
Request Info
Have a question about this article or want to learn more?
