

Austin Real Estate Inventory Snapshot: April 2025 Data and Trends
Published | Posted by Dan Price
Austin Real Estate Inventory Snapshot: April 2025 Data Breakdown
The Austin real estate market remains a focal point for homebuyers, sellers, and investors, and the latest residential inventory snapshot from Team Price Real Estate, released on April 25, 2025, provides a detailed look at housing trends in the region. Covering the Austin Area Multiple Listing Service (MLS), the City of Austin, and new construction, this snapshot offers critical data on active listings, sales, and market dynamics. With a wealth of figures reflecting year-over-year (YoY) changes, the report is a vital resource for understanding the availability of homes in one of Texas’s fastest-growing markets.
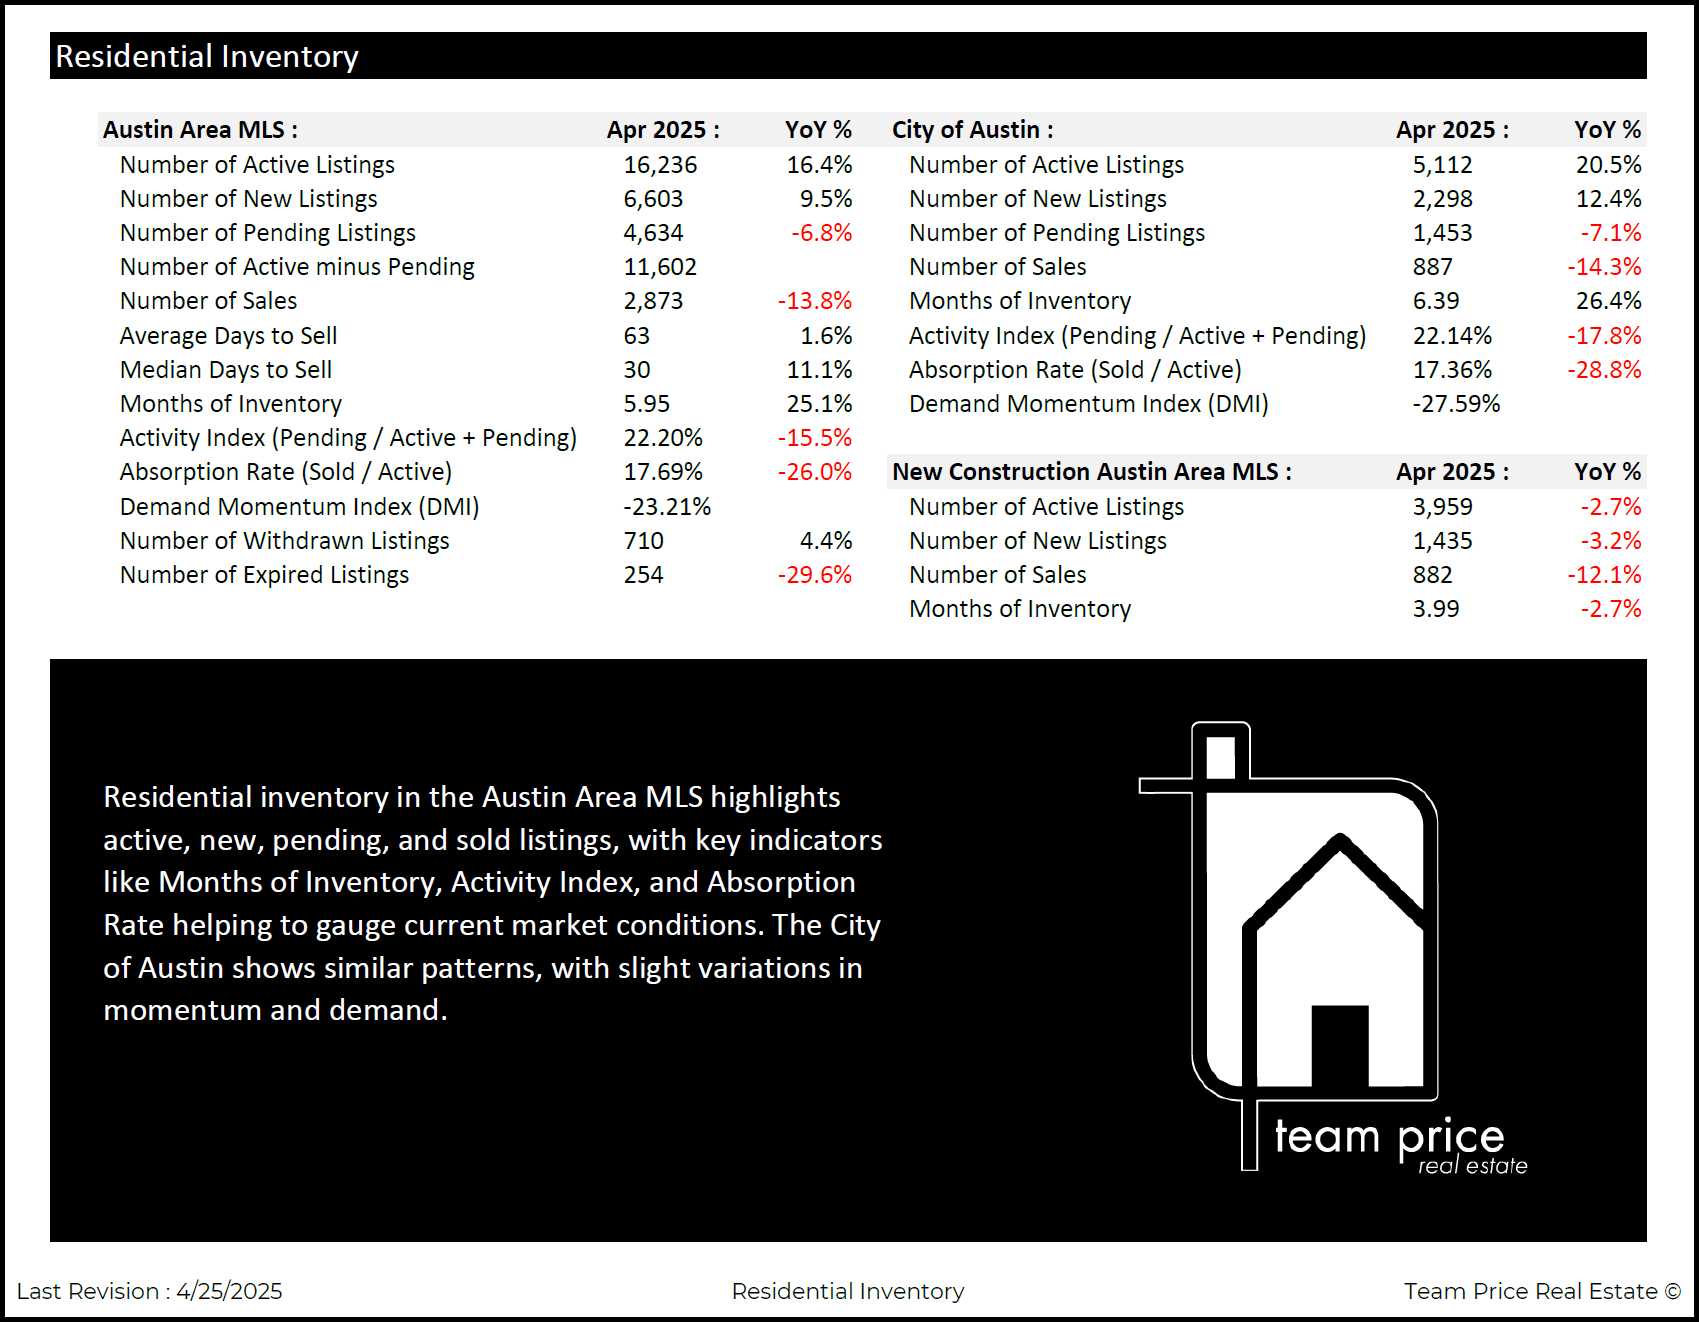
In the Austin Area MLS, the number of active listings in April 2025 reached 16,236, marking a significant 16.4% increase compared to April 2024. This growth suggests more homes are available for buyers, potentially easing some of the supply constraints that have characterized Austin’s market in recent years. New listings also rose, with 6,603 homes added to the market, up 9.5% from the previous year. However, pending listings, which indicate homes under contract, dropped to 4,634, a 6.8% decline YoY, resulting in 11,602 active listings minus pending. Sales activity saw a notable decrease, with 2,873 homes sold, down 13.8% from April 2024. These figures point to a market with growing inventory but softening demand.
The time it takes to sell a home in the Austin Area MLS has slightly increased. The average days to sell rose to 63 days, a 1.6% YoY increase, while the median days to sell climbed to 30 days, up 11.1%. Months of inventory, a key indicator of market balance, stood at 5.95 months, reflecting a 25.1% YoY increase. This suggests a shift toward a more balanced market, as a higher months-of-inventory figure indicates homes are taking longer to sell. The activity index, calculated as pending listings divided by active plus pending listings, was 22.20%, down 15.5% YoY, while the absorption rate, or sales divided by active listings, fell to 17.69%, a 26.0% YoY decline. The demand momentum index (DMI) registered at -23.21%, further signaling reduced buyer activity. Additionally, 710 listings were withdrawn (up 4.4% YoY), and 254 listings expired (down 29.6% YoY), reflecting varied seller strategies.
Focusing on the City of Austin, the snapshot reveals similar trends but with distinct nuances. Active listings in the city totaled 5,112, a 20.5% YoY increase, indicating a robust supply of homes within Austin’s urban core. New listings grew to 2,298, up 12.4% from April 2024, while pending listings fell to 1,453, down 7.1% YoY. Sales in the city dropped to 887, a 14.3% YoY decline, aligning with the broader regional trend of reduced transaction activity. The months of inventory in the City of Austin reached 6.39, up 26.4% YoY, suggesting a slower-paced market compared to the previous year. The activity index was 22.14%, down 17.8% YoY, and the absorption rate was 17.36%, a 28.8% YoY decrease. The DMI for the city was -27.59%, indicating even weaker demand momentum than the broader Austin Area MLS.
The new construction segment, a significant part of Austin’s housing market, showed different dynamics. In the Austin Area MLS, new construction active listings totaled 3,959, down 2.7% YoY, suggesting a slight contraction in available new homes. New listings for new construction reached 1,435, a 3.2% YoY decrease, and sales totaled 882, down 12.1% from April 2024. The months of inventory for new construction was 3.99 months, also down 2.7% YoY, indicating a tighter supply compared to the overall market. These figures reflect a more stable new construction sector, with less pronounced inventory growth than the resale market.
The April 25, 2025, snapshot from Team Price Real Estate highlights a market in transition. The increase in active listings across the Austin Area MLS (16,236) and the City of Austin (5,112) points to greater opportunities for buyers, but the decline in sales (2,873 regionally and 887 in the city) and pending listings (4,634 regionally and 1,453 in the city) suggests caution among buyers. The rise in months of inventory, particularly in the City of Austin at 6.39 months, indicates a shift toward a buyer-friendly market, though new construction remains relatively constrained at 3.99 months. Metrics like the activity index (22.20% regionally, 22.14% in the city) and absorption rate (17.69% regionally, 17.36% in the city) further underscore reduced market velocity.
For those navigating the Austin housing market, the Team Price Real Estate snapshot provides a clear picture of inventory trends as of April 2025. The data, last revised on April 25, 2025, captures a critical moment in the spring selling season, when listings typically peak. Buyers may find more options with 16,236 active listings regionally and 5,112 in the city, but longer selling times (63 average days regionally) and declining sales suggest a need for strategic timing. Sellers, meanwhile, face a market with 710 withdrawn and 254 expired listings, indicating the importance of competitive pricing and marketing.
In summary, the Austin Area Real Estate Inventory Snapshot for April 2025, compiled by Team Price Real Estate, offers a comprehensive view of residential housing trends. With 16,236 active listings in the Austin Area MLS, 5,112 in the City of Austin, and 3,959 in new construction, the market shows increased supply but reduced demand, as evidenced by declining sales and pending listings. As Austin continues to grow, this snapshot serves as a valuable tool for understanding the evolving dynamics of one of the nation’s most watched real estate markets.
FAQ
1. How many homes are for sale in Austin, TX, in April 2025?
As of April 25, 2025, the Austin Area MLS reported 16,236 active listings, a 16.4% increase from April 2024. In the City of Austin, active listings totaled 5,112, up 20.5% year-over-year. Additionally, new construction active listings reached 3,959, according to the Team Price Real Estate snapshot.
2. Is Austin’s housing market a buyer’s or seller’s market in April 2025?
The April 2025 snapshot from Team Price Real Estate indicates a shift toward a buyer-friendly market. With 6.39 months of inventory in the City of Austin and 5.95 months in the Austin Area MLS, higher inventory levels and declining sales (2,873 regionally, down 13.8%) suggest more options for buyers and less competition compared to previous years.
3. How long does it take to sell a home in Austin in April 2025?
In the Austin Area MLS, the average days to sell a home in April 2025 was 63 days, up 1.6% from April 2024, while the median days to sell was 30 days, an 11.1% year-over-year increase. These figures, reported by Team Price Real Estate, reflect a slightly slower sales pace amid growing inventory.
Request Info
Have a question about this article or want to learn more?
