

Austin Area Activity Index 2015–2025: Real Estate Trends and City Insights
Published | Posted by Dan Price
Austin Area Activity Index: A Decade of Market Shifts and City Trends
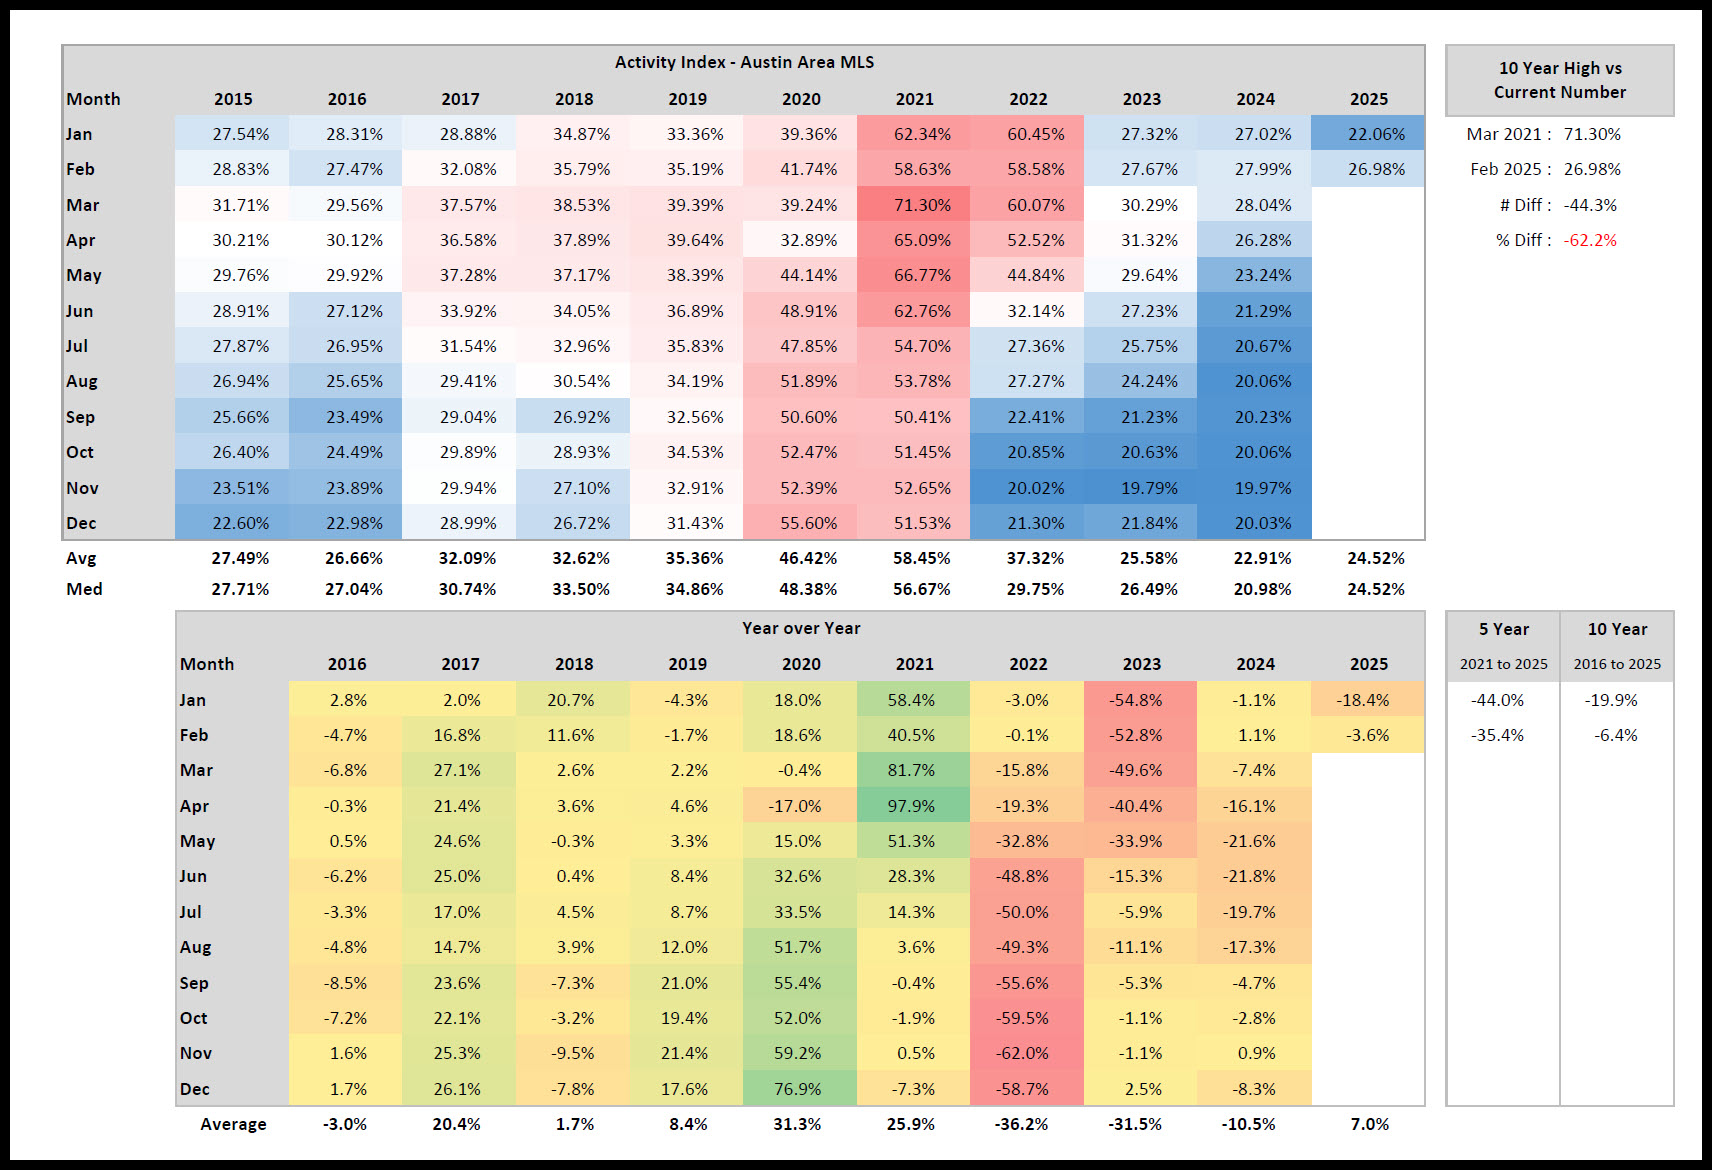
The Austin Area real estate market has undergone significant changes over the past decade, reflected in the Austin Area Activity Index. This index, calculated by dividing the number of pending properties by the total of active and pending properties, provides a clear view of market activity—essentially measuring what percentage of the total market is under contract at any given time. The data from 2015 to 2025 reveals both dramatic peaks and noticeable declines, offering a window into the evolving dynamics of the Austin-area housing market.
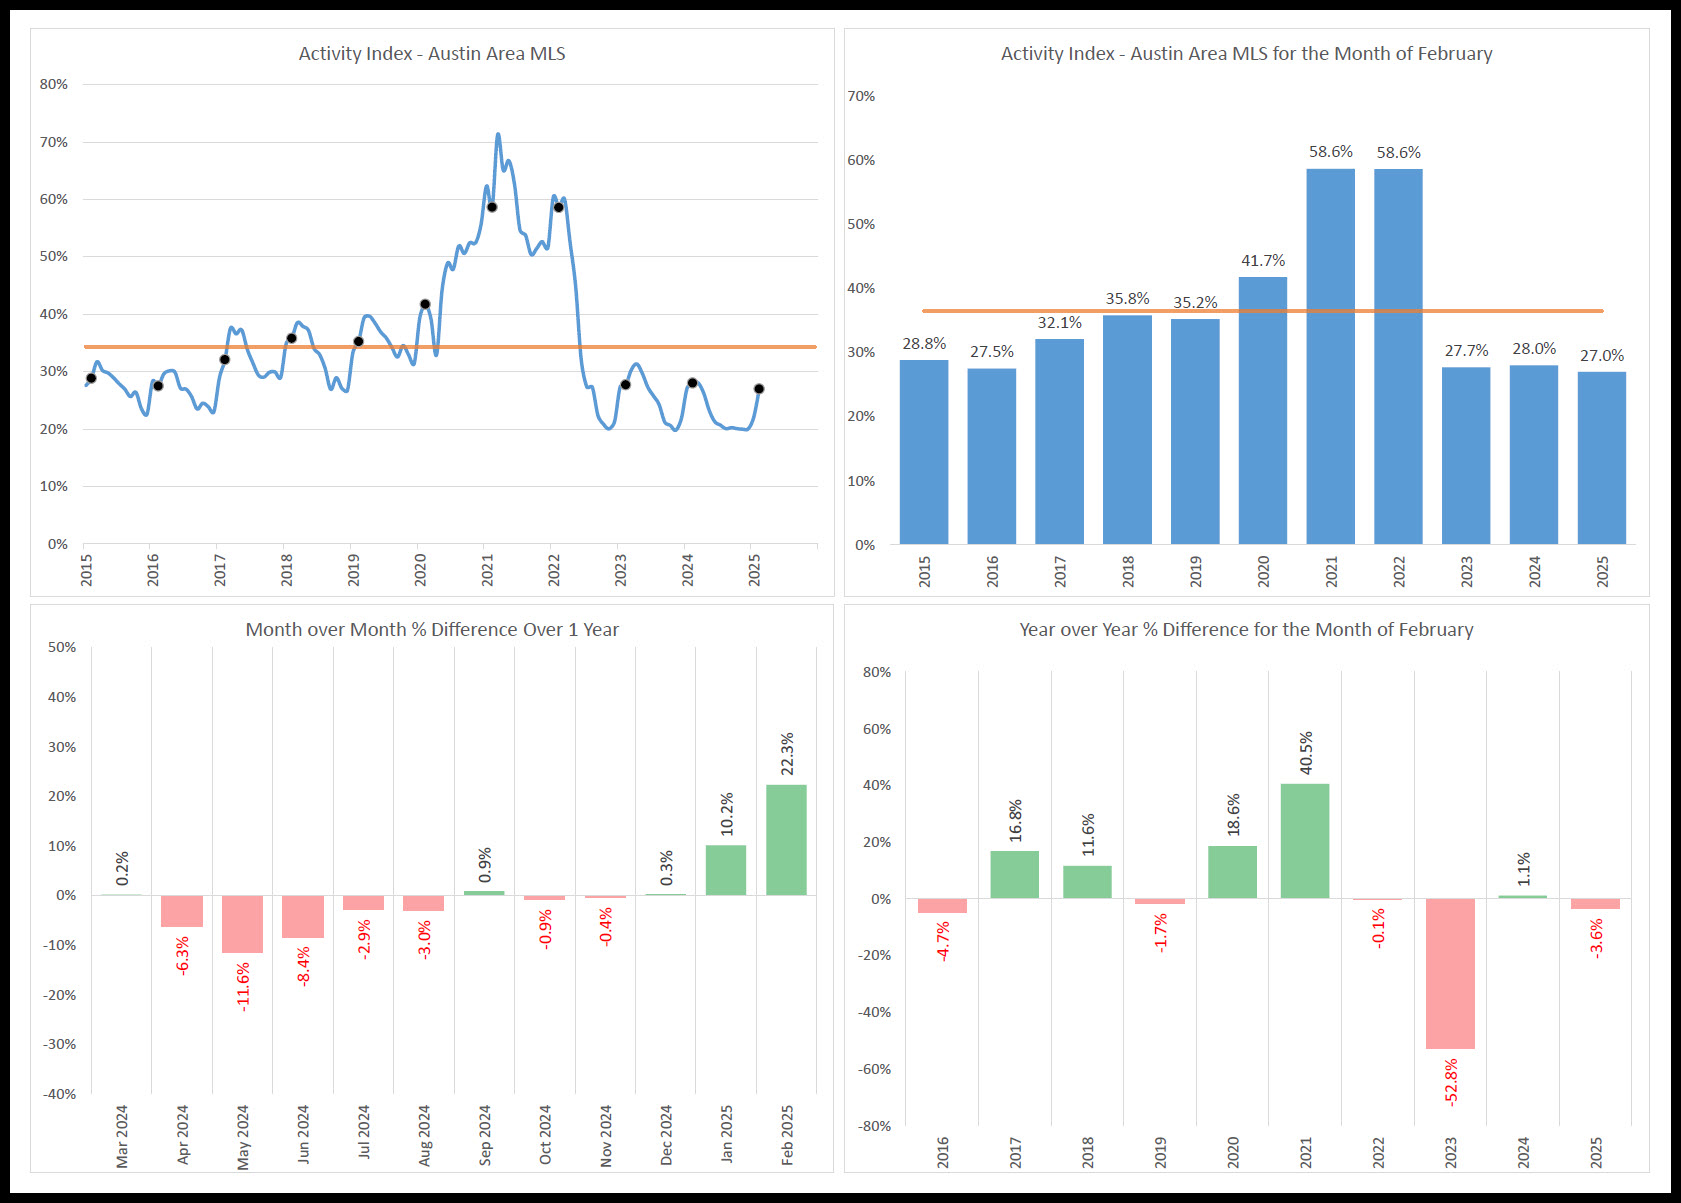
From 2015 to 2019, the market experienced steady growth. The average Activity Index rose from 27.5% in 2015 to 35.4% in 2019, reflecting a healthy, balanced market. This period was marked by consistent seasonal fluctuations but overall positive momentum. However, the landscape shifted dramatically with the 2021 to 2022 housing boom. The index surged to 46.4% in 2020 and peaked at an unprecedented 58.5% in 2021. March 2021 recorded the highest monthly index at 71.3%, a clear indicator of the frenzied buyer demand driven by low interest rates and limited housing supply.
Yet, this surge proved unsustainable. From 2022 onwards, the Activity Index saw a sharp decline, averaging 37.3% in 2022 and plummeting to 25.6% in 2023. By 2024, the index hit a low of 22.9%, reflecting a cooling market. A slight rebound to 24.5% in 2025 suggests stabilization, though the market remains far from its 2021 highs. Year-over-year data highlights this trend vividly. For instance, April 2024's Activity Index dropped 62.2% compared to its peak in April 2021.
Despite these fluctuations, month-over-month data shows subtle signs of recovery. From January 2025 to February 2025, the index rose from 22.06% to 26.98%, indicating a modest uptick in market activity. However, when viewed against the backdrop of previous years, this increase still falls short of signaling a full market rebound.
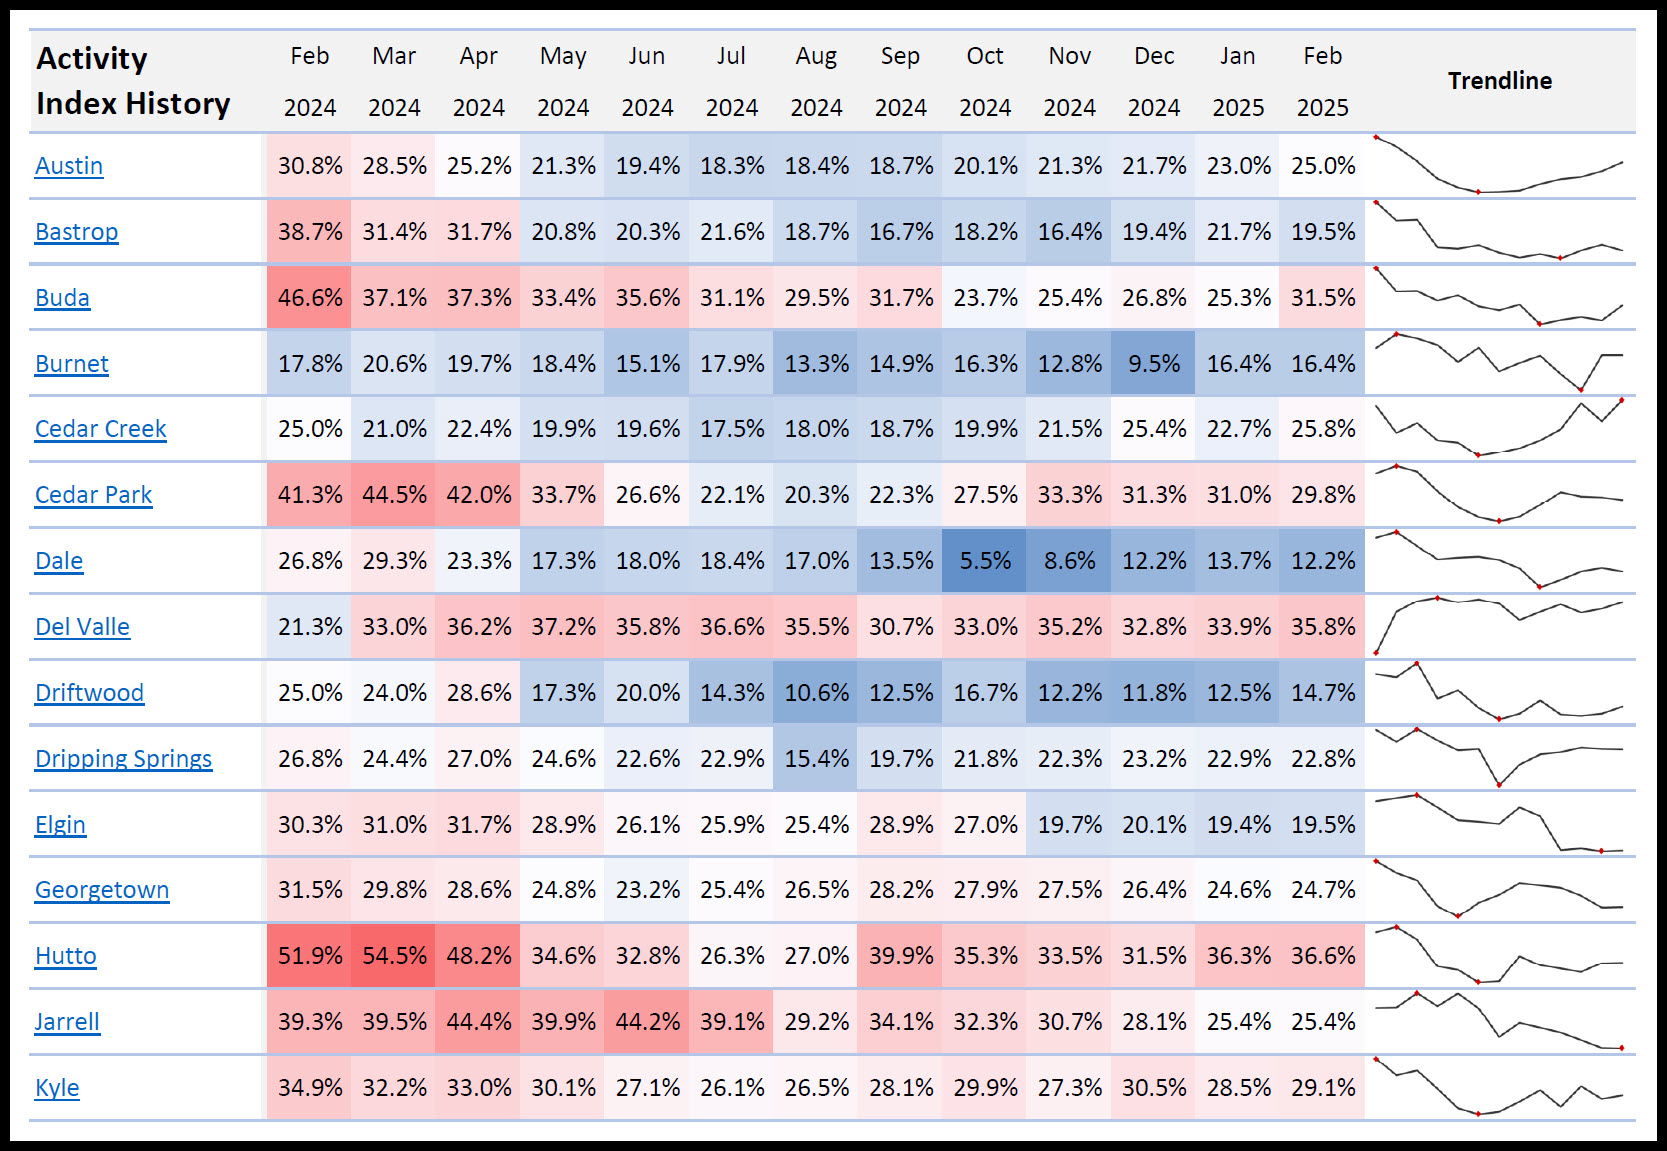
Examining specific cities within the Austin Area provides deeper insights into localized market conditions. Austin, the region’s hub, saw its Activity Index decline from 30.8% in February 2024 to a low of 18.3% in July 2024, before climbing back to 25.0% by February 2025. This trend suggests a cooling market with gradual stabilization. Round Rock followed a similar pattern, starting at 38.8% in February 2024, dipping to 23.5% in August 2024, and recovering slightly to 28.8% by February 2025.
Georgetown’s Activity Index demonstrated relative stability, beginning at 31.5% in February 2024 and ending at 24.7% in February 2025. While this represents a decline, the drop was less severe compared to other cities, indicating a more resilient market. Kyle’s index fluctuated between 34.9% in February 2024 and 26.1% in July 2024, with a slight recovery to 29.1% by February 2025, reflecting moderate market activity.
Buda showcased stronger resilience with an Activity Index of 46.6% in February 2024, dipping to 29.5% in August 2024, but rebounding to 31.5% by February 2025. This suggests a relatively stable market compared to other cities. Cedar Park experienced more volatility, starting at 41.3% in February 2024, dropping to 20.3% in August 2024, and stabilizing at 29.8% by February 2025, highlighting fluctuating demand.
Pflugerville’s Activity Index began at 41.6% in February 2024, decreased to 28.7% in August 2024, and rose slightly to 31.3% by February 2025. Leander followed a similar trajectory, with its index moving from 38.7% in February 2024 to 24.8% in September 2024, before settling at 26.8% in February 2025. These patterns indicate a general cooling trend with minor signs of stabilization.
Overall, the data points to a market that has shifted from the intense activity of the 2021 to 2022 boom to a more balanced, albeit slower, state. The month-over-month increases suggest cautious optimism, but the year-over-year declines highlight the challenges that remain. As the market continues to adjust, both buyers and sellers will need to navigate these changing conditions with informed strategies.
For those seeking the most current data and insights, Team Price Real Estate offers daily updates on the Austin Area Activity Index and other market statistics. Visit the Insights and Statistics section at teamprice.com to stay informed on the latest trends and make data-driven decisions in the ever-evolving Austin real estate market.

Data published on Wednesday, February 12 2025. For the most up to date information, please visit :
Request Info
Have a question about this article or want to learn more?
